Apr 16 2014
Rule 1: The first plot you do should never be the one you present
Drawing Good Graphs
- If the “story” is simple, keep it simple.
- If the “story” is complex, make it look simple.
- Tell the truth – don’t distort the data.
– Ross Ihaka https://www.stat.auckland.ac.nz/~ihaka/120/Lectures/lecture03.pdf
The three stages of a telling a story with graphics
Data Exploration
What is the story to tell?
- you don't care about the little plotting details
- plots are answering and raising questions
Visualization exploration
Which plot(s) tell the story best?
- different ways of mapping variables to aesthetics
- different subsets? summaries?
Match perceptual and data topology: e.g. shape is unordered, so it should be used for unordered variable
Make comparisons as easy as possible:
- Position on a common scale (Easiest)
- Position along identical, non-aligned scales
- Length
- Angle / Slope
- Area
- Volume
- Colour properties (Hardest)
Polishing
How can I make it easy for the viewer?
- nice labeling,
- careful color choice,
- captions? annotations?
- version for screen or print?
- tweaks to axes, grid lines etc.
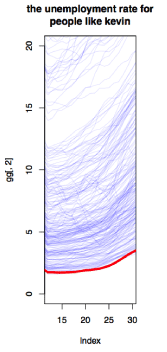
Raw R
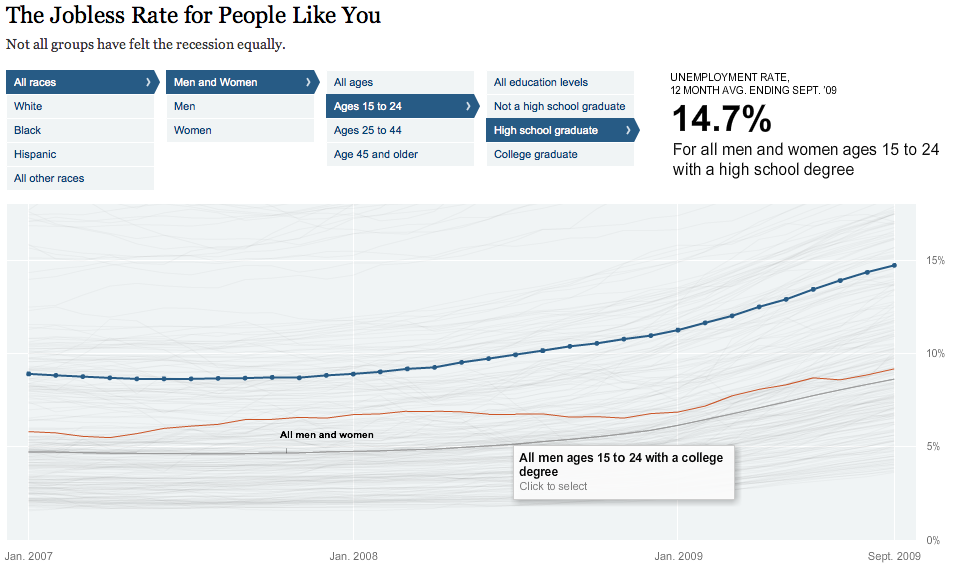
http://simplystatistics.org/2012/06/01/interview-with-amanda-cox-graphics-editor-at-the-new/
Polished NYT